Solutions Based on Measurement Technology
Temperature Sensing Ink that Detects Deviations from Controlled Temperature Range
Cold chains require control within a pre-determined temperature range depending on the products such as frozen products, refrigerated products, room-temperature products, and biomedicines. Accordingly, Hitachi has developed a temperature sensing ink that irreversibly detects deviations from upper and lower limits of a control temperature indicated by changing color. Information including products’ control conditions, time, and location can be obtained by attaching temperature sensing labels that combine this ink with item-specific identification codes and then reading the labels with smartphones at individual distribution points such as storage warehouses and stores. Utilizing the temperature sensing labels and the IoT, consistent quality control from production to sale can be achieved at low cost.


Due to the tightening of rules governing freight management for foods and medical products set by the U.S. Food and Drug Administration's (FDA) Food Safety Modernization Act (FSMA) and the European Union's Good Distribution Practice (GDP), cold chain management reform and market growth are expected. Currently, temperature control systems using data loggers are being used but, from a cost perspective, they are applicable only to managing products in the aggregate such as with trucks and container transportation. This poses a difficulty in satisfying the need for fine-grained control of individual products from production to consumption.
In response, Hitachi has developed an ultra-low-cost temperature sensor that can be attached to individual items with the aim of using the sensor in conjunction with Internet of Things (IoT) technology to provide quality control systems that maintain consistent control of products from production to consumption, which cannot be achieved with the current temperature control systems.
Temperature sensing ink(1) changes its color due to deviations from the upper and lower limits of pre-determined control temperatures for each product. The ink possesses irreversibility such that its color does not revert to the original color even if the temperature returns to the control temperature range after the ink changes color due to a deviation from the range. Thanks to these features, the existence of deviations from control temperatures can be determined in distribution processes from production to consumption by reading color changes in the ink on products as numerical data.
Different products in cold chains need to be controlled within different temperature ranges, represented by frozen products (≤ 15°C), refrigerated products (2 to 10°C), room-temperature products (10 to 20°C), and biomedicines (2 to 8°C). If temperature sensing ink is to be applied to control the temperature of these products, technologies that control temperature ranges in which the ink changes its color are required. Accordingly, Hitachi has produced a range of inks to suit these different product categories.
The greater the deviation from control temperatures and the longer the deviation lasts, the more food and medical products will deteriorate. Likewise, the greater the temperature deviation and the longer the temperature sensing ink is exposed to a temperature outside the control temperature range, the deeper the color of the ink will be. This means that, by attaching the ink to a product when it is packaged, its temperature control history and degraded state after that can be analyzed from the ink's color depth.
In the course of transportation from producers to consumers, the delivery unit of products becomes smaller from large-sized trucks and containers to packages and individual products. Conventionally, product temperature control has been exclusively performed per large-sized truck and container by using recorders with expensive sensors. Meanwhile, since temperature sensing ink can be attached to individual products at low cost, consistent temperature control from producers to consumers can be achieved (see Figure 1). As a method to attach the ink to individual products, not only labels, but also industrial inkjet printers have been considered (see Figure 2). Accordingly, Hitachi has also been working on technical development of inkjet printer ink.
Temperature data for individual products can be handled by using temperature sensing labels with the temperature sensing ink applied(2) and a system for scanning them. The temperature sensing labels (see Figure 3) are made up of the temperature sensing ink and a QR code*. Scanning a label with a smartphone acquires identification (ID) details such as the product's date of manufacture and lot number as well as temperature control information determined from the color depth of the ink. Time and location can be also collected using the smartphone's global positioning system (GPS) and clock. The data can be managed on a server in an integrated manner.
The temperature sensing labels are attached to products subject to logistics management and the information read by the smartphone is forwarded to the server by a dedicated app. The labels are scanned four times: when dispatched from the production site, when goods are received at a warehouse, when dispatched from the warehouse, and when delivered to a retailer. By linking product IDs in the scanned data to ordering information, it is also possible to show the product's transportation quality information to users such as producers, wholesalers, logistics operators, and retailers. In the case of products such as vegetables, which are handled in bulk, different labels are needed: for the transportation container unit per species for long-haul from production to warehouses, and for the packaging unit after sorting work such as transporting cardboard boxes over the last mile from warehouses to retailers (see Figure 4). To do this, traceability is achieved by attaching different labels for long-haul and last-mile transportation, respectively, and linking the information carried by the respective labels. To keep the task of scanning labels as simple as possible for local delivery drivers and warehouse staff, a logic has been introduced that automatically infers producers and processes from locations and times without requiring special input.
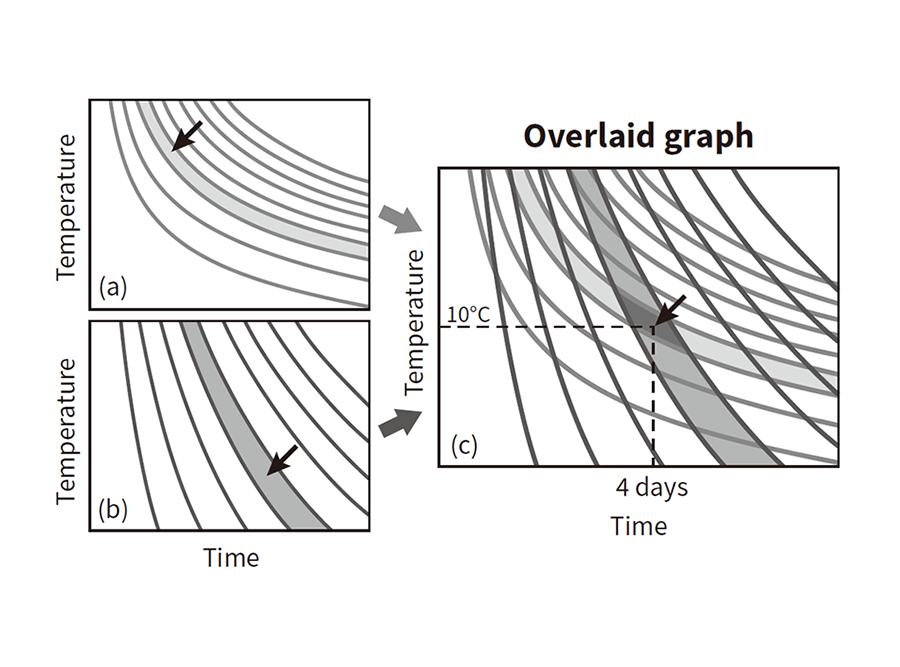
The color depth of the temperature sensing ink, which depends on the temperature and duration of temperature deviations, can be described in a contour graph with these as axes [see Figure 5 (a) and Figure 5 (b)]. It is difficult to identify the temperature and the duration of temperature deviations if one type of ink is used for one label. On the other hand, by using two or more types of ink for one label, it is possible to identify the temperature and the duration of deviations within a certain range [see Figure 5 (c)].
Indicators representing product degradation differ depending on the product type. In the case of vegetables, for example, the ratios of chlorophyll or ascorbic acid serve as indicators of freshness(3). For meat or fish, a freshness indicator called the K value is calculated, as given below, based on the degree of nucleic acid degradation from the molar concentration of the product being analyzed(4). Here, ATP represents adenosine triphosphate, ADP is adenosine diphosphate, AMP is adenylic acid, IMP is inosinic acid, Ino is inosine, and Hx is hypoxanthine.
In the case of medical products, deterioration is indicated by the reduction in their effect (potency).
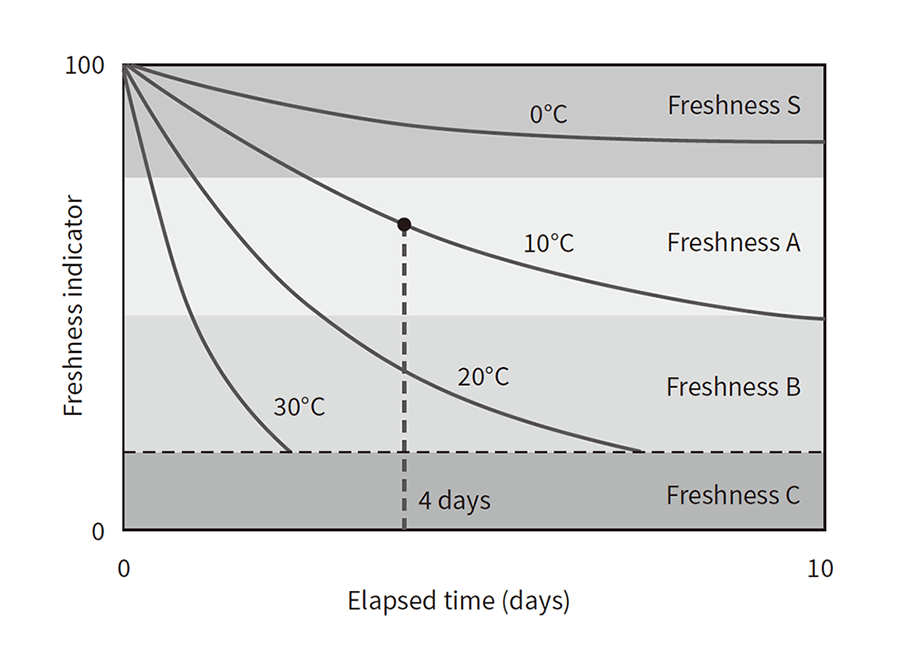
Although these indicators change gradually, their dependency on temperatures and times can be collated in a database as quality deterioration data for different foods and medicines (see Figure 6). Freshness and degradation can be shown by comparing this database and the deviation time and temperature data obtained by the above-mentioned method.
Figure 5—How to Identify Deviation Temperature and Time with 2 Types of Ink Given pre-defined color change contour graphs (a) and (b), representing the characteristics of two types of ink, the temperature and duration of a deviation can be identified after identifying the bands for the observed colors and then overlaying the two graphs as shown in (c).
Figure 6—Graph of How Quickly Food Deteriorates at Different Temperatures The graph shows an example of how rapidly food deteriorates depending on the elapsed time and the temperature at which it is stored. The appropriate freshness indicators and deterioration curves are different depending on the food type.
The economic development in Southeast Asia over recent years has been accompanied by a rising number of people with high incomes(5), bringing about increasing demand for foods that are subject to quality control(6). Unfortunately, such foods have not been provided due to the region's underdeveloped cold chains. To overcome this problem, Hitachi started food chain platforms (FCPFs) that establish cold chain logistics and supply high-quality foods (see Figure 7). FCPFs make use of not only temperature sensing labels, but also Hitachi's other advantageous technologies such as block chains, logistics management, image diagnosis / artificial intelligence (AI), cold boxes, and freshness and aging simulators, etc. to offer value that meets various stakeholders' demands by providing services including food quality control, traceability, dynamic matching, and logistics instructions.
In order to demonstrate the suitability of temperature sensing labels, a key technology behind the concept of FCPFs, logistics quality control using these labels was adopted for perishable food to be transported to retailers and restaurants in Ho Chi Minh City between December 2017 and January 2018. Vegetables from farms in Da Lat were transported by refrigerated trucks to refrigeration stores in Ho Chi Minh City and then they were delivered to individual retailers by coldbox-equipped motorbikes after sorting. One temperature sensing label was affixed to each container per vegetable type delivered from the farmers and the cold boxes on the motorbikes used for delivery from the cool store to the retailers. The ink's color depth data of all the temperature sensing labels used in this demonstration test was successfully collected by the local staff (see Figure 8). As a color depth of 1.1 or more is the threshold for a temperature deviation, the figure shows that temperature deviations occurred for two of the vegetable containers. The data loggers that were also used during the test confirmed that the pre-cooling of the refrigerated trucks was not sufficient. This demonstrated that the temperature sensing labels worked properly and encouraged the logistics operators to improve their practices. Hitachi is currently proceeding with the commercialization of FCPFs in 2019 in consideration of the demonstration of their feasibility for business. In parallel with this, the mass-production of temperature sensing labels is also under consideration.
Currently, Hitachi is proceeding with operation tests with customers in order to realize consistent temperature control per product from production to consumption, by utilizing the temperature sensing ink and IoT technologies. Information such as products' temperature control, times, and locations can be collected by shooting temperature sensing labels, which combines products' ID codes and this ink, with a smartphone, enabling fine-grained temperature control at lower cost than ever before.
In the future, Hitachi intends to deploy these businesses through collaborative creation with other group companies.